In this article, I’ll take you through my journey of optimizing memory in Binacle.Net, an API built in C# and .NET.
Introduction
Binacle.Net started as a hobby project aimed at solving the 3D Bin Packing Problem in real-time. The API has grown to include a range of algorithms, some fully developed and others still in progress.
At the time of writing Binacle.Net includes both Fitting and Packing functions. While these functions might use algorithms with similar names, they are distinct in purpose and output. The Fitting function assesses whether all items can fit within a bin, while the Packing function aims to maximize bin space by fitting as many items as possible and tracking their positions.
The performance and memory data in this article were derived using BenchmarkDotNet in .Net 8 and are specific to this algorithm and its application within Binacle.Net’s Fitting function.
The charts were made with chartbenchmark.net, and the memory usage is indicated by the thin purple line within the larger bar which indicates execution time.
The Problems
It’s important to take you back before the Fitting and Packing functions existed.
One of the very first problems I encountered included an optimization of over 90% in speed and memory reduction. This, as you can imagine, was false as the algorithms didn’t operate at all or exited early. Tests with scenarios crafted by hand that guaranteed, to an extent, the new algorithm operated correctly, were paramount if I was to continue down this path.
Another issue was with architecture. I based the algorithms on a common interface, which made it easy to switch between different versions and, in the future, different types of algorithms, whilst providing a fairly equal testing environment. This, however, presented a new problem, one that I have to this day.
Each time I needed to refactor the common interface, the original algorithm’s performance could potentially change as well. I could not easily maintain the original algorithm just for historical reasons, so I decided, the benefits that the common interface provides are significantly more valuable than preserving the original algorithm through refactor and test iterations.
The graph below, is the first I have records of. During that time, the algorithm accepted many bins, but only returned the smallest applicable.
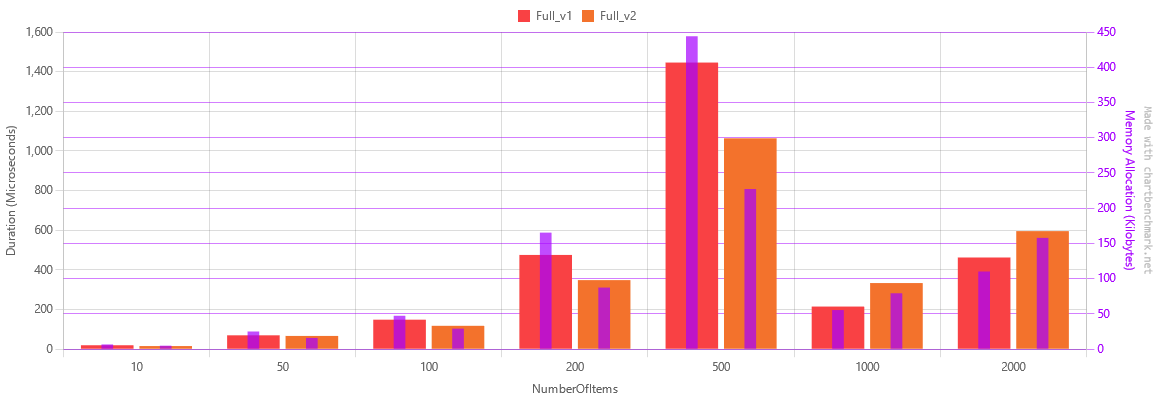
The 2nd version showed improvements, but something was wrong, both versions showed a sudden drop in memory and speed on 1000 items. After more investigation I realized that somewhere between 500 and 1000 items, the bins hit their limit and the items could no longer fit into any bin, meaning the algorithms exited early.
For clarity I was using only 5 cm cubes to do the benchmarks. So I run the calculations by hand to confirm it and also gave me new test cases to run the benchmarks on.
The values were carefully chosen so I could see the performance breakpoints of each bin. There were 3 bin sizes, the smallest fits up to 192 items, while the medium fits up to 384 items and the large one fits up to 576.
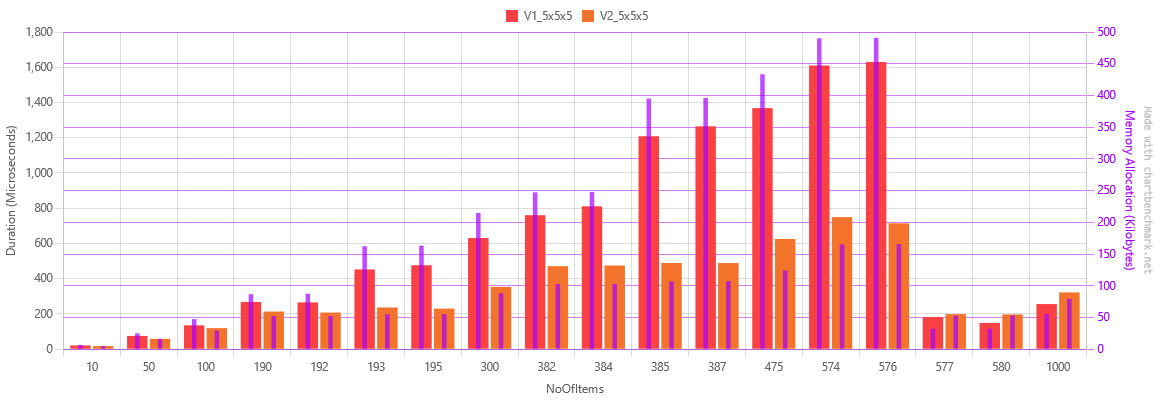
Looking at the second chart carefully, I could see that the algorithm spiked dramatically from 192 to 193 items, from 384 to 385 and then it would predictably drop at 577 items.
This made me understand that the algorithm didn’t detect that the items could not fit in the smaller size bins, and still tried to fit them. Only when it had failed to do so, did it move on to the next bin size. Version 2 had that issue fixed. You can see the sudden increases with only 1 item more, are present in version 1, but not in version 2.
Furthermore, as evidenced by the chart, in the early exit scenario where no bin could accommodate all the items, version 1 of the algorithm was more performant than version 2. This was all due to how version 2 was created.
The Refactor
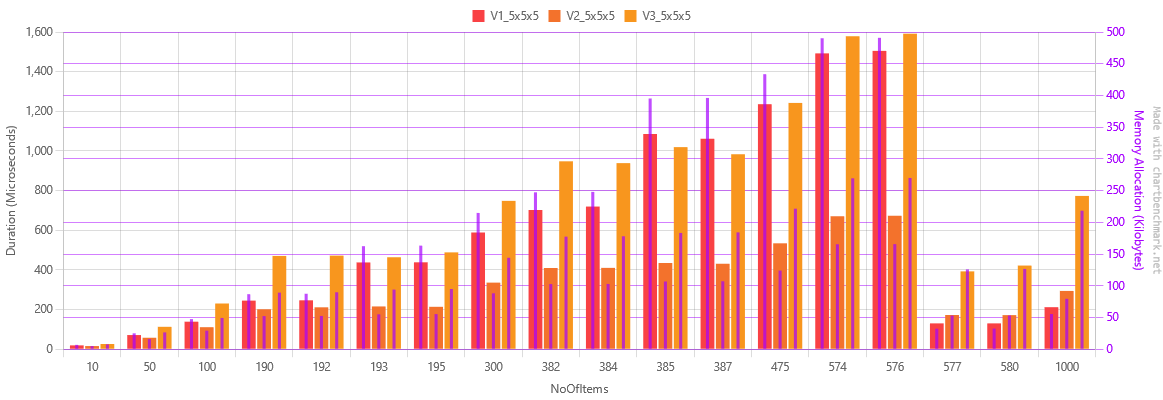
After a few months I began to create another algorithm, what would later be named as the Packing function. Initially, I named it Version 3, as with all that came before it. Eventually, I changed my mind, as the algorithm essentially produced a different result. It was still in lines with the First Fit Decreasing, but it had a different purpose. It kept track of the positions of the items and it would try to pack as much as possible.
Due to how the new algorithm worked, it had visibly worse performance, after all, it had more work to do.
Realizing this new algorithm function had an entirely different purpose I began refactoring the algorithms to separate the two, which gave birth to the Fitting and Packing functions.
Through this refactor iteration I had to throw out the common interface entirely and create two new ones. As such, the performance of the original algorithm changed as well.
This was also the time the algorithms stopped accepting multiple bins.
Now
After the refactoring, I began to further improve the algorithms, and after many attempts and versions, I ended up with the following.
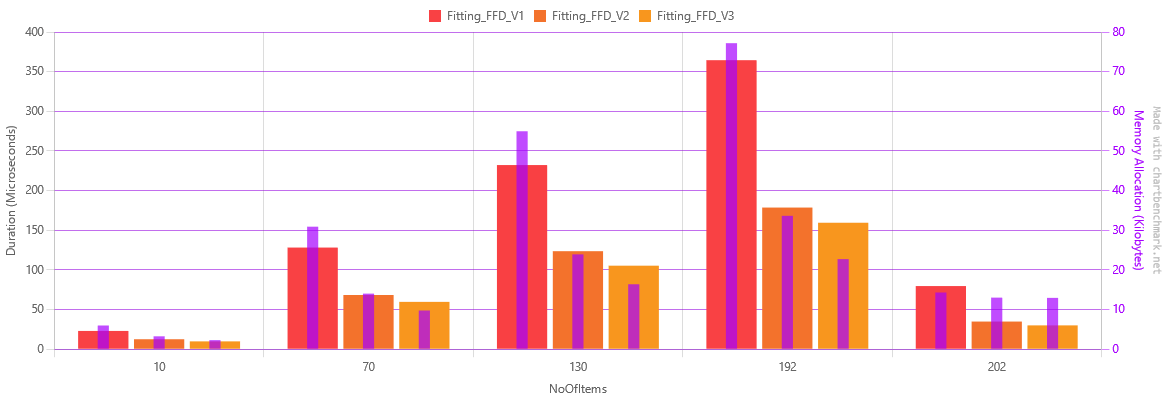
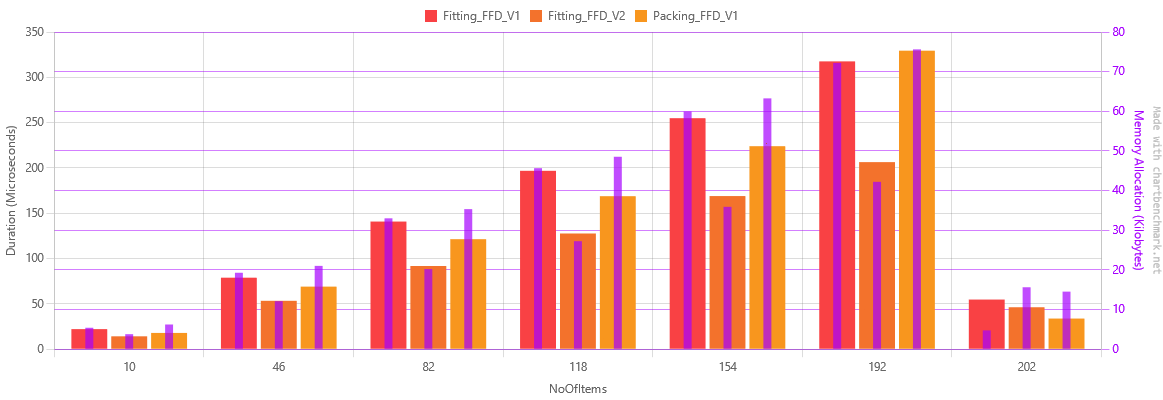
The graph now only shows the Fitting function as this is the subject of this article. It also displays a 70% memory reduction between version 1 and version 3, as well as a little over 50% reduction in execution time.
Below is the table with the actual numbers.
| Method | NoOfItems | Mean | Error | StdDev | Median | Ratio | RatioSD | Gen0 | Allocated | Alloc Ratio |
|---|---|---|---|---|---|---|---|---|---|---|
| Fitting_FFD_V1 | 10 | 23.091 μs | 0.4605 μs | 1.2051 μs | 22.663 μs | 1.00 | 0.07 | 1.9531 | 5.99 KB | 1.00 |
| Fitting_FFD_V2 | 10 | 12.562 μs | 0.2427 μs | 0.2151 μs | 12.557 μs | 0.55 | 0.03 | 1.0529 | 3.26 KB | 0.54 |
| Fitting_FFD_V3 | 10 | 9.908 μs | 0.1333 μs | 0.1182 μs | 9.886 μs | 0.43 | 0.02 | 0.7477 | 2.3 KB | 0.38 |
| Fitting_FFD_V1 | 70 | 128.198 μs | 2.5180 μs | 2.5858 μs | 127.988 μs | 1.00 | 0.03 | 10.0098 | 30.91 KB | 1.00 |
| Fitting_FFD_V2 | 70 | 68.411 μs | 1.2600 μs | 1.2375 μs | 68.635 μs | 0.53 | 0.01 | 4.5166 | 14.02 KB | 0.45 |
| Fitting_FFD_V3 | 70 | 59.717 μs | 1.1810 μs | 2.2182 μs | 59.333 μs | 0.47 | 0.02 | 3.1738 | 9.77 KB | 0.32 |
| Fitting_FFD_V1 | 130 | 232.221 μs | 4.4224 μs | 5.7504 μs | 230.766 μs | 1.00 | 0.03 | 17.8223 | 54.98 KB | 1.00 |
| Fitting_FFD_V2 | 130 | 123.661 μs | 2.2121 μs | 2.7166 μs | 123.454 μs | 0.53 | 0.02 | 7.5684 | 23.92 KB | 0.44 |
| Fitting_FFD_V3 | 130 | 105.357 μs | 1.6066 μs | 1.5028 μs | 105.367 μs | 0.45 | 0.01 | 5.2490 | 16.39 KB | 0.30 |
| Fitting_FFD_V1 | 192 | 364.521 μs | 6.9847 μs | 6.5335 μs | 363.258 μs | 1.00 | 0.02 | 24.9023 | 77.19 KB | 1.00 |
| Fitting_FFD_V2 | 192 | 178.677 μs | 2.9441 μs | 2.6098 μs | 177.678 μs | 0.49 | 0.01 | 10.7422 | 33.65 KB | 0.44 |
| Fitting_FFD_V3 | 192 | 159.475 μs | 2.1216 μs | 1.9845 μs | 158.870 μs | 0.44 | 0.01 | 7.3242 | 22.73 KB | 0.29 |
| Fitting_FFD_V1 | 202 | 79.654 μs | 1.4574 μs | 1.2919 μs | 80.027 μs | 1.00 | 0.02 | 4.6387 | 14.3 KB | 1.00 |
| Fitting_FFD_V2 | 202 | 34.895 μs | 0.6630 μs | 0.7636 μs | 34.790 μs | 0.44 | 0.01 | 4.2114 | 13.01 KB | 0.91 |
| Fitting_FFD_V3 | 202 | 30.055 μs | 0.4198 μs | 0.3927 μs | 29.987 μs | 0.38 | 0.01 | 4.2114 | 12.95 KB | 0.91 |
How I did it
First I researched. One of the first things that stood out was LINQ, especially when it came down to closures, as it was presented in such a way that it was the most worthwhile in terms of gain for the effort put into it.
When I started rewriting the algorithms without LINQ, there were definite improvements.
In the following two examples you can see how closures increase memory allocation especially inside loops.
I’ve put the full benchmark solution in BenchmarkTests-R2CM, should you wish to test it yourself.
foreach (var author in this.Authors!)
{
  var article = author.Articles.FirstOrDefault(x => x.WordCount > wordCountMin && x.WordCount <= wordCountMax);
  // ...
}

// VS

foreach (var author in this.Authors!)
{
  foreach (var article in author.Articles)
  {
    if (article.WordCount > wordCountMin && article.WordCount <= wordCountMax)
    {
      //...
    }
  }
}
| Method | NoOfAuthors | Mean | Error | StdDev | Ratio | RatioSD | Gen0 | Allocated | Alloc Ratio |
|---|---|---|---|---|---|---|---|---|---|
| Linq | 1 | 628.2 ns | 13.15 ns | 18.00 ns | 1.00 | 0.04 | 0.0610 | 192 B | 1.00 |
| Foreach | 1 | 236.2 ns | 5.17 ns | 5.31 ns | 0.38 | 0.01 | 0.0277 | 88 B | 0.46 |
| Linq | 5 | 2,720.3 ns | 56.42 ns | 161.88 ns | 1.00 | 0.08 | 0.2213 | 696 B | 1.00 |
| Foreach | 5 | 737.9 ns | 14.54 ns | 19.90 ns | 0.27 | 0.02 | 0.0553 | 176 B | 0.25 |
| Linq | 10 | 4,736.7 ns | 94.33 ns | 144.05 ns | 1.00 | 0.04 | 0.4349 | 1368 B | 1.00 |
| Foreach | 10 | 1,340.2 ns | 26.95 ns | 26.47 ns | 0.28 | 0.01 | 0.1030 | 328 B | 0.24 |
As you can see, from the table above, for 1 author, when using LINQ, we have 104 bytes of allocation more than the foreach loop. With 5 authors we have 520 bytes and with 10, we have 1,040 bytes, more than the foreach loop. If we divide 520 by 5, we get 104, which is the same result for 1,040 divided by 10. That means every loop we do, it allocates an extra 104 bytes over the foreach loop, just for the closure.
This is also a subject for further analysis; as the article is already getting too long.
Another change I made was my data structure. In Version 1 of the algorithm I only had 3 properties to hold the dimensions and I had an iterator which returned new items for each orientation.
public IEnumerable<Item> GetOrientations()
{
  yield return new Item { ID = this.ID, Length = this.Length, Width = this.Width, Height = this.Height };
  // and so on ..
}
Version 2 changed that and held a copy of the original dimensions. The rotation of the item, however, was handled internally by swapping the variables.
class Item
{
  public int Height { get; set; }
  private int originalLength;
  // ...

  private int currentOrientation = 0;
  public void Rotate()
  {
    // perform rotation
  }
}
The first table I want to show you is the benchmarks that measure the memory allocation when creating these two items.
| Method | NoOfItems | Mean | Error | StdDev | Median | Ratio | RatioSD | Gen0 | Allocated | Alloc Ratio |
|---|---|---|---|---|---|---|---|---|---|---|
| Item1Allocations | 1 | 225.1 ns | 5.16 ns | 6.71 ns | 224.2 ns | 1.00 | 0.04 | 0.0405 | 128 B | 1.00 |
| Item2Allocations | 1 | 236.3 ns | 5.35 ns | 7.49 ns | 234.4 ns | 1.05 | 0.04 | 0.0458 | 144 B | 1.12 |
| Item1Allocations | 5 | 777.6 ns | 11.62 ns | 10.87 ns | 774.8 ns | 1.00 | 0.02 | 0.1192 | 376 B | 1.00 |
| Item2Allocations | 5 | 799.3 ns | 14.63 ns | 37.25 ns | 787.2 ns | 1.03 | 0.05 | 0.1450 | 456 B | 1.21 |
| Item1Allocations | 10 | 1,385.7 ns | 26.80 ns | 23.76 ns | 1,388.2 ns | 1.00 | 0.02 | 0.2308 | 728 B | 1.00 |
| Item2Allocations | 10 | 1,443.9 ns | 29.22 ns | 27.33 ns | 1,436.8 ns | 1.04 | 0.03 | 0.2823 | 888 B | 1.22 |
As you can see Version 2 allocates more memory per item, specifically 16 more bytes, which is 4 bytes per additional dimension and 4 more for keeping track of the orientation.
However, by changing how my items are structured I was able to achieve the following result.
| Method | NoOfItems | Mean | Error | StdDev | Ratio | RatioSD | Gen0 | Allocated | Alloc Ratio |
|---|---|---|---|---|---|---|---|---|---|
| Item1Rotations | 1 | 676.79 ns | 13.935 ns | 12.353 ns | 1.00 | 0.02 | 0.0887 | 280 B | 1.00 |
| Item2Rotations | 1 | 42.60 ns | 1.301 ns | 1.781 ns | 0.06 | 0.00 | - | - | 0.00 |
| Item1Rotations | 5 | 3,374.68 ns | 66.055 ns | 90.416 ns | 1.00 | 0.04 | 0.4463 | 1400 B | 1.00 |
| Item2Rotations | 5 | 185.15 ns | 4.050 ns | 4.821 ns | 0.05 | 0.00 | - | - | 0.00 |
| Item1Rotations | 10 | 6,672.12 ns | 131.100 ns | 183.783 ns | 1.00 | 0.04 | 0.8926 | 2800 B | 1.00 |
| Item2Rotations | 10 | 364.59 ns | 7.761 ns | 7.622 ns | 0.05 | 0.00 | - | - | 0.00 |
Version 2 is orders of magnitude faster and allocates 0 memory for rotating the item.
By trading some more memory upfront I was able to make a dramatic improvement over memory and speed in the rotation of items.
There are a few issues I have yet to deal with, and do require more work, but these were benefits I achieved with minimal core changes, albeit with a lot of testing and experimentation, and what you don’t see are the failed attempts.
Lessons Learned
I could have chosen not to optimize the algorithms and waited until Binacle.Net could potentially start getting serious use, but this is still a hobby project and there was a lot I learned from this and I hope some of it may have been of some use to you.
Here’s what I learned.
1. Don’t do it.
In most scenarios you will rarely need to optimize anything, or at least wait until you really need it. Doing it early can eat up your time and a lot can go wrong during optimization.
2. Tests, and some more tests
Make sure you have proper tests in place to ensure your code produces the expected output. Doing so will allow you to refactor key parts, then run them to ensure nothing broke.
3. Aim for the low hanging fruit.
Identify what can easily be changed first, LINQ can be a good candidate. The optimization game is one of effort and output. At first, you will most likely want to aim to achieve the most you can get, with as little effort possible.
4. Interpret the results.
Your benchmark results may have an underlying meaning. Try to analyze them as they may reveal something about your code.
5. You will probably fail… a lot!
Try to materialize those ideas, but don’t be discouraged, some will fail and make the performance worse and that’s good, because now you learned something.
6. Data structures.
Sometimes you may have to consider changing your data structures to achieve better performance.
That’s all I have for you, take care!
Photo by Bernd 📷 Dittrich on Unsplash